Posterior Distribution of a Parameter
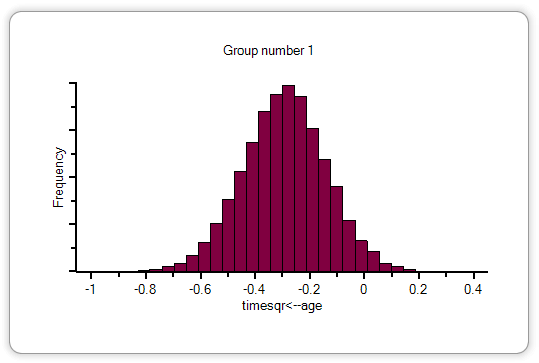
Below is a graph from Example 32 of the User's Guide. It shows the posterior distribution of the regression weight for using age to predict timesqr. The graph shows everything that is known about the value of the regression weight. There is about a 50-50 chance that the regression weight is between -0.4 and -0.2. (About half the area is in that range.) The regression weight is almost guaranteed to be between -0.8 and 0.2.
