Predictive Distribution for a Missing Measurement
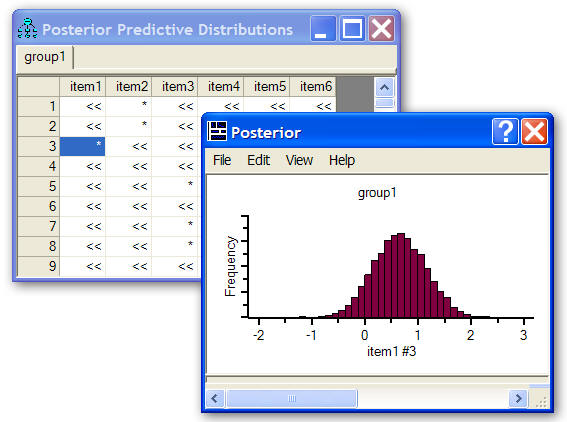
In Example 33 of the User's Guide, Subject 3 did not respond to Item 1. The output below shows that Subject 3's score on Item 1's underlying numeric variable (Item 1 itself is categorical) is almost certainly between -0.5 and 2. (Virtually all of the area in the histogram is between those two values.) The score is probably between 0.25 and 1. (Most of the area is in that range.)